eCommerce KPI Benchmarks - How Does Your Brand Compare?
The question we get asked most often is - what is a good ROAS? Or similarily - what is a good Customer Acquisition Cost (CAC)? Or what is Cost Per Click can I expect from Meta?
Well finally we can give you definitive answers - with new data from Triple Whale - Using data from over 11,000 Triple Whale customers we can uncover trends for the most common ad platforms like Google, Meta, TikTok, and a Blended view to understand the broad trends across all platforms. The only downside to the data is it is not broken down by region.
So let’s dig in to the Q1 2024 data and see how you compare. We will break it down by platform first, and then dig into some of the top eCommerce categories so that you can compare.
Industrywide data - Meta, Google, TikTok and Blended KPIs
Meta Q1 Average 2024
While there have been some ups and downs across the quarter - we can see that on Meta things are staying pretty consistent across the quarter.
ROAS - 2.35
CPA - US $35.55
CPC - US $0.61
CPM - US $9.74

Meta ROAS
Google Ads Q1 Average 2024
Google has stronger ROAS than Meta - probably because it tends to skew to the lower funnel - and while steady this quarter, it recently saw a bit of a crash.
ROAS - 4.14
CPA - US $15.89
CPC - US $0.85
CPM - US $10.99

Google ROAS
TIKTOK Q1 Average 2024
TikTok ROAS is surprisingly close to Meta, as is the CPC, with more volatility during the quarter.
ROAS - 2.44
CPA - US $14.44
CPC - US $0.62
CPM - US $5.63
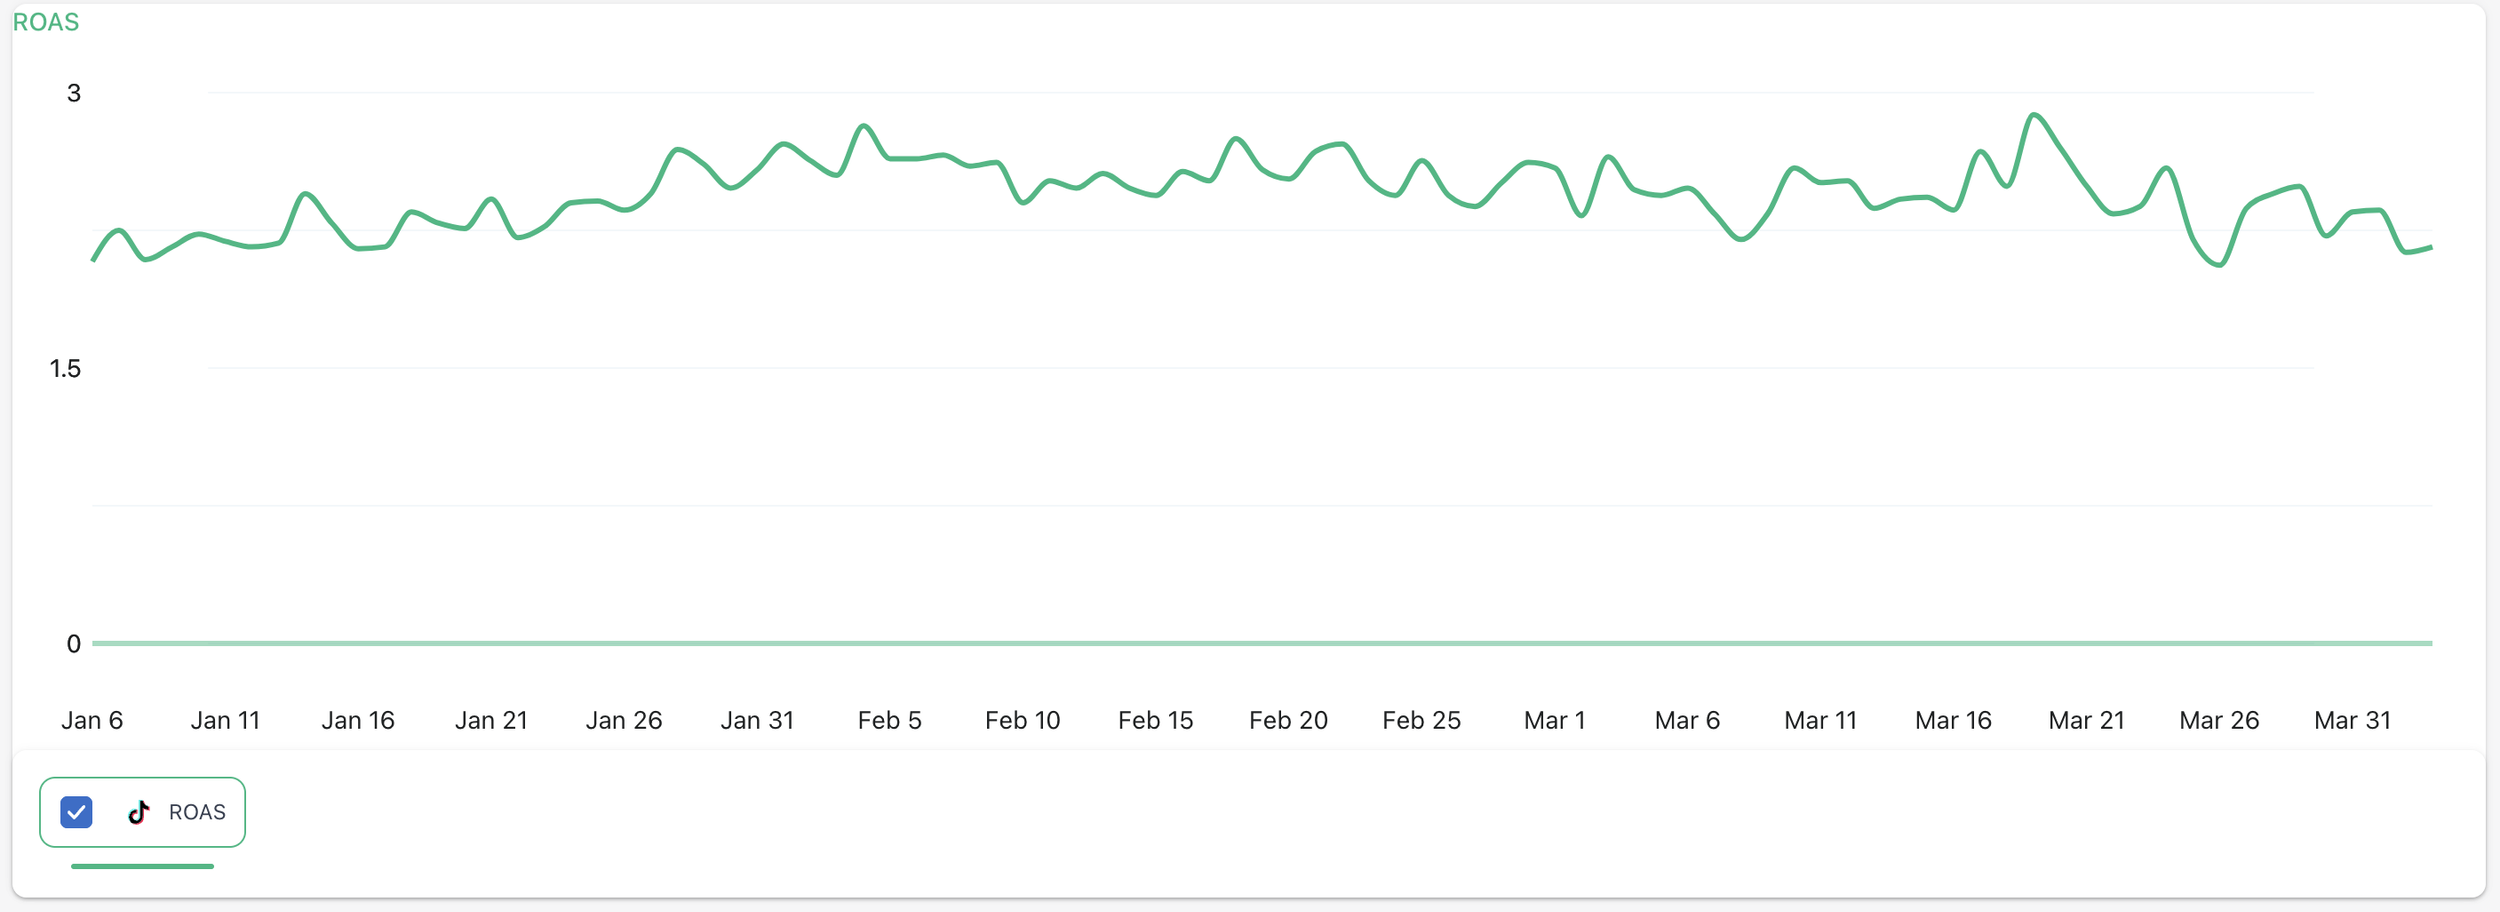
Tiktok ROAS
Average Blended Performance Data Q1 Average 2024
A similar pattern when you blend it all together, with a big drop off in the last few days - could that be due to data latency in Google?
ROAS - 2.84
CPA - US $23.99
CPC - US $0.67
CPM - US $9.12

Average ROAS
Industry Specific Data
Now lets dive into the industry categories - what is surprising to see here is the difference between the performance of the different industries. What we can’t see here is how profitable they are, but its likely that the lower ROAS categories like beauty and pets have better gross margins on product and are banking on higher LTV from repeat customers.
Home and Garden Q1 Average 2024
META Performance
ROAS - 2.96
CPA - US $53.48
CPC - US $0.60
CPM - US $9.73

Average ROAS - Home and Garden
Clothing Q1 Average 2024
META Performance
ROAS - 3.01
CPA - US $31.81
CPC - US $0.53
CPM - US $8.44

Average ROAS - Clothing
Pet Supplies Q1 Average 2024
META Performance
ROAS - 1.56
CPA - US $42.88
CPC - US $0.63
CPM - US $9.96

Average ROAS - Pet Supplies
Toys and Hobbies Q1 Average 2024
META Performance
ROAS - 2.47
CPA - US $30.39
CPC - US $0.50
CPM - US $7.81

Average ROAS - Toys and Hobbies
Health and Beauty Q1 Average 2024
META Performance
ROAS - 1.87
CPA - US $34.88
CPC - US $0.75
CPM - US $12.57

Average ROAS - Health and Beauty